Reports
Help Topics
- Admin Reports
- Login Report
- Attendance Report
- Assessment Reports
- UnAttempted User Report
- Attempted Users Report
- Course Report
- Attempted Users Report
- Un-attempted User Report
- Learning Path Reports
- Learning Path List in Reports
- User – My Reports
- My Learning Path Report
- My Course Report
- My Assessment Report
- Download Report
- Reports in App
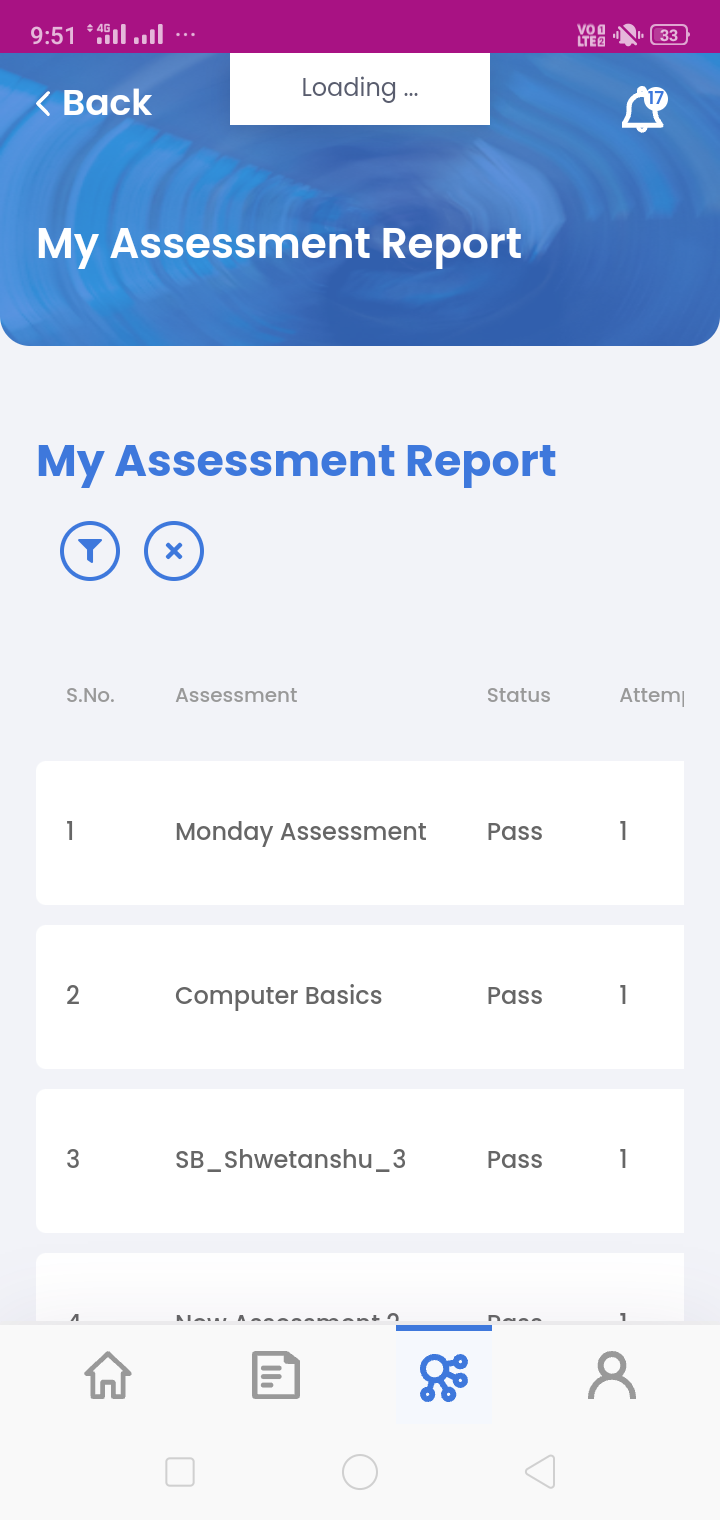
- My Assessment Report in App
- My Course Report in App
Admin Reports
As an admin, we would have access to lots of data but visual and graphical interpretation of the data helps us to understand and grasp the information quicker and better.
Bytecasting offers the Admins, a few default reports which are useful for admin to analyze how the users/learners are using the system.
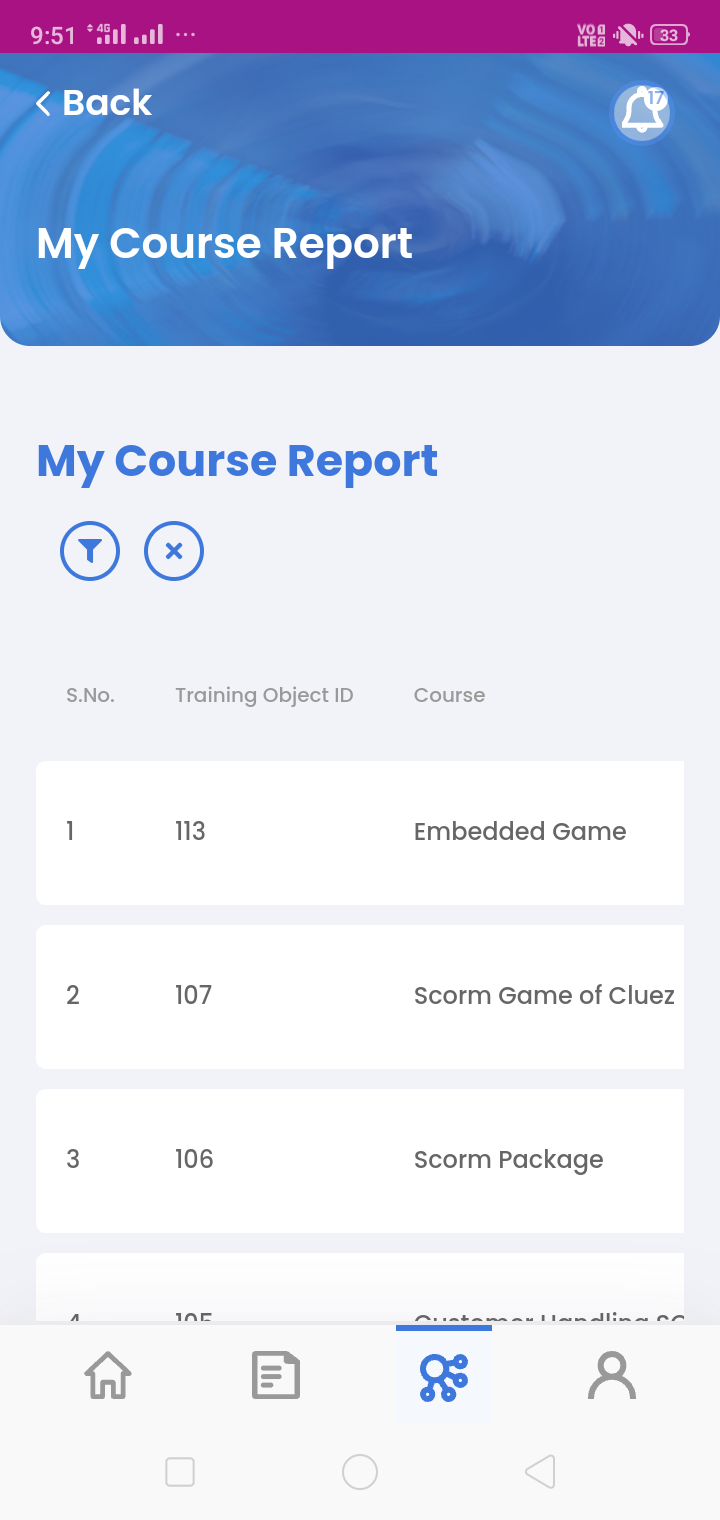
Reports for admins can be accessed via the left menuReports once the Admin logins in to bytecasting LMS
Login Report
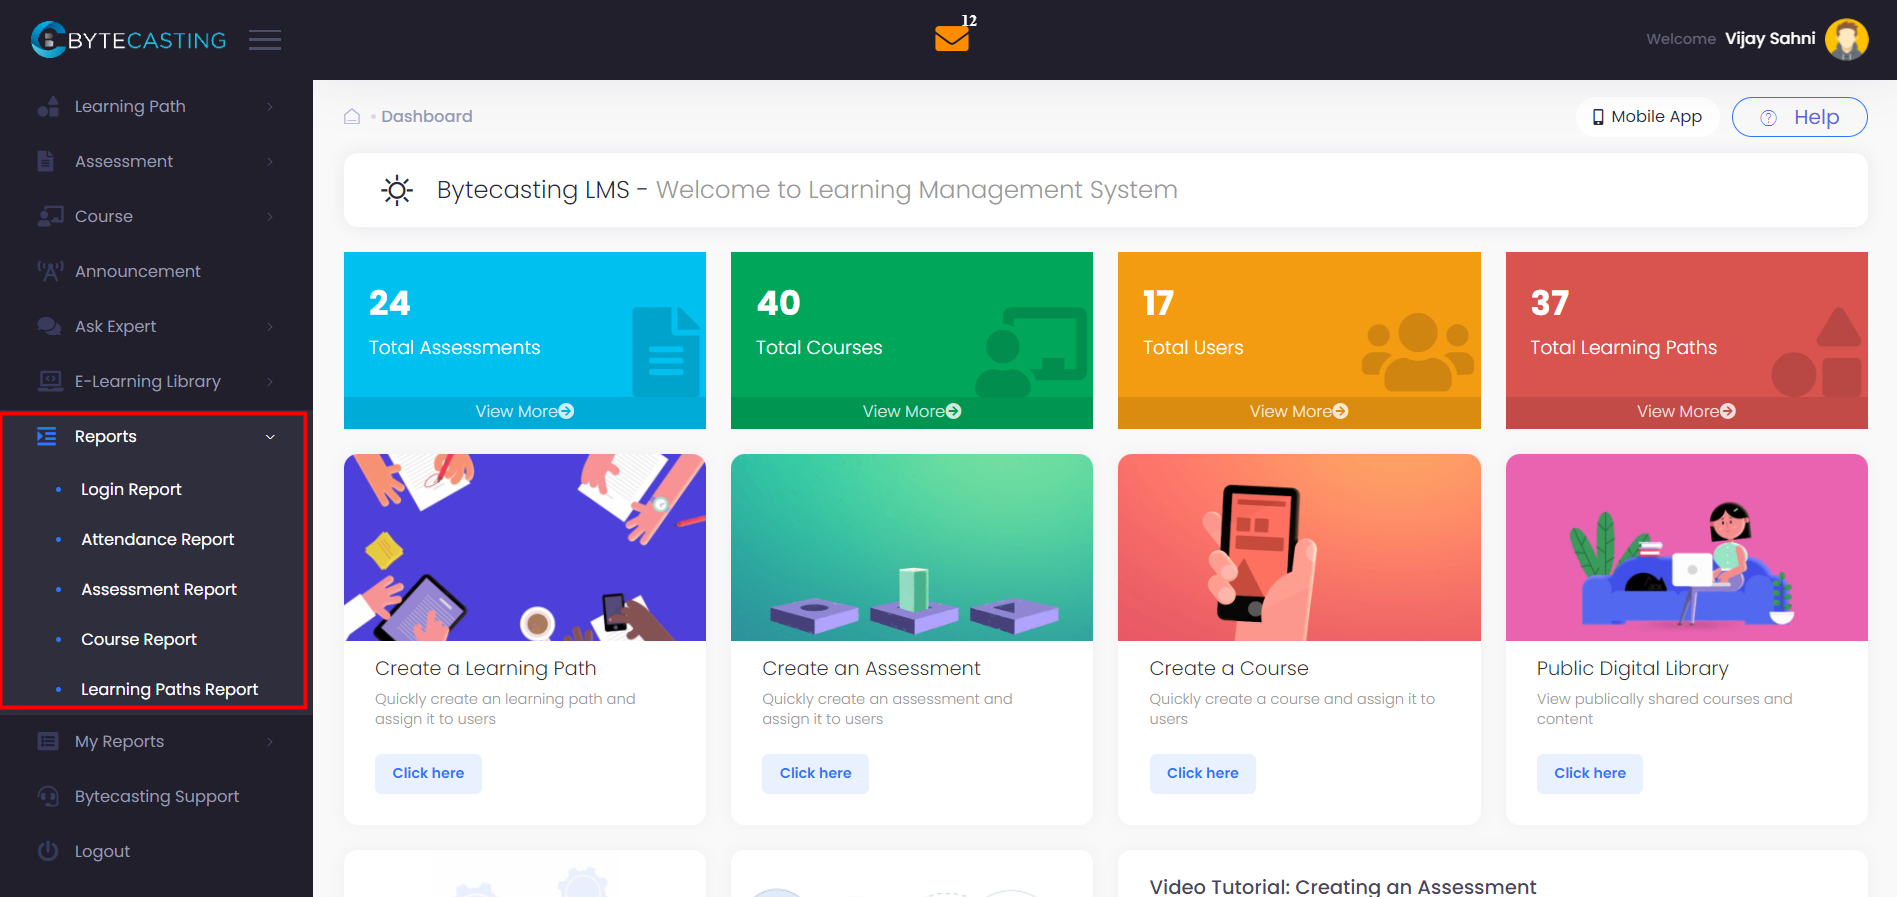
Login reports shows us details about which employee has logged into the system with its date and timestamp.
Admin can search any user’s data using a filter or search bar.
Attendance Report
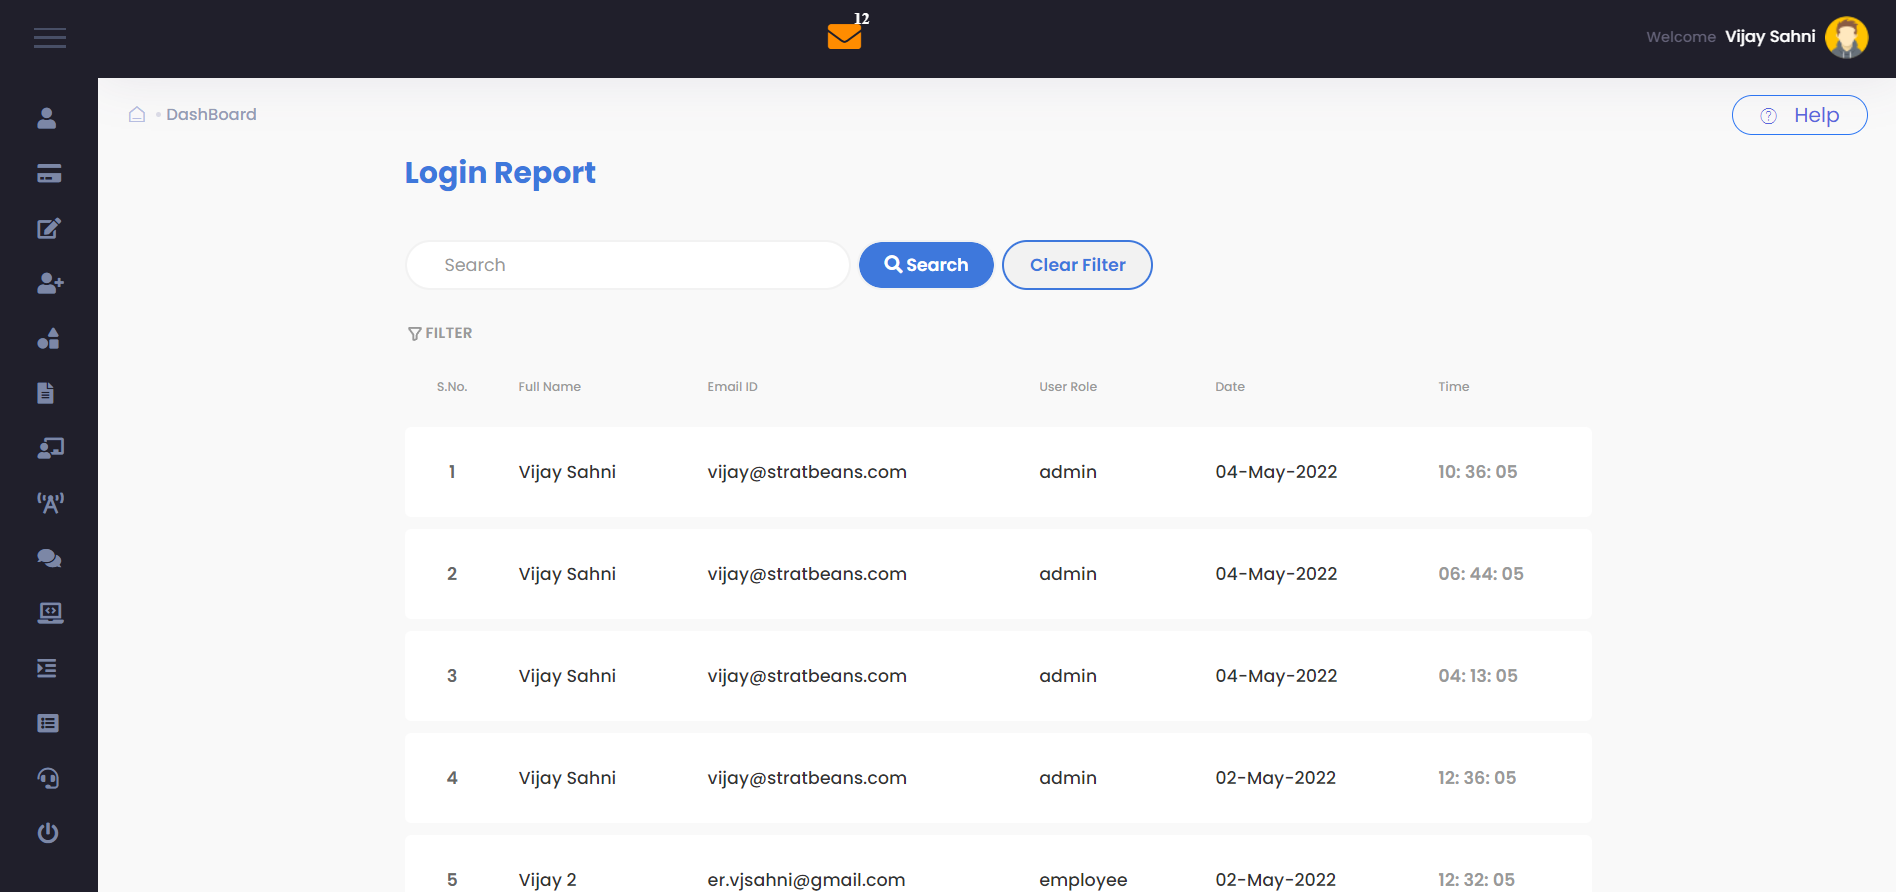
All users assigned to a classroom training in the Learning Program , are marked for their attendance.
It is the Trainer’s responsibility to mark attendance for users attending the classroom session.
Based on the marked attendance, the admin can see how much percentage of users are present & absent in the classroom for a particular date. Admin can search any ILT data using a filter or Search bar.
Assessment Reports
This report shows the Admin the number of assessments created and Assigned to users in the system
This shows the number of user who have attempted a particular assessment. The Percentage of users who have passed, failed and Not attempted the assessment.
Right click on the 3 dots to further analyze the Attempted Users and Unattempted Users reports
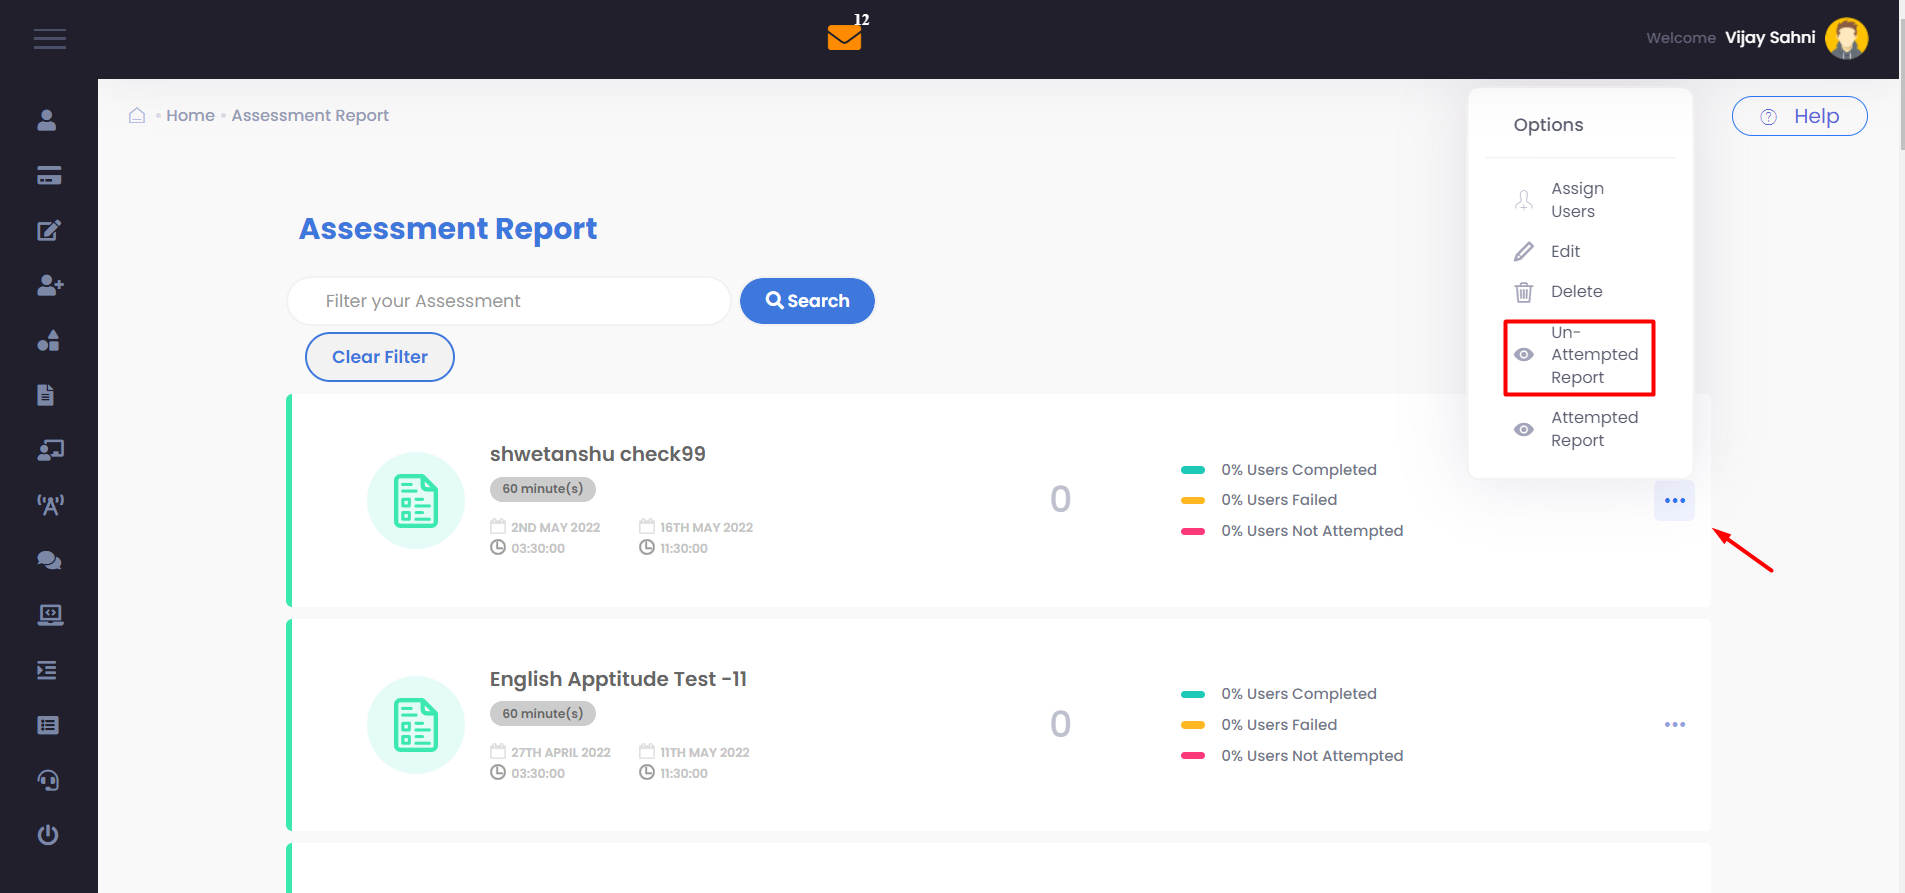
UnAttempted User Report
This shows the list of users who are assigned to the course but have not yet attempted the Assessment even once.
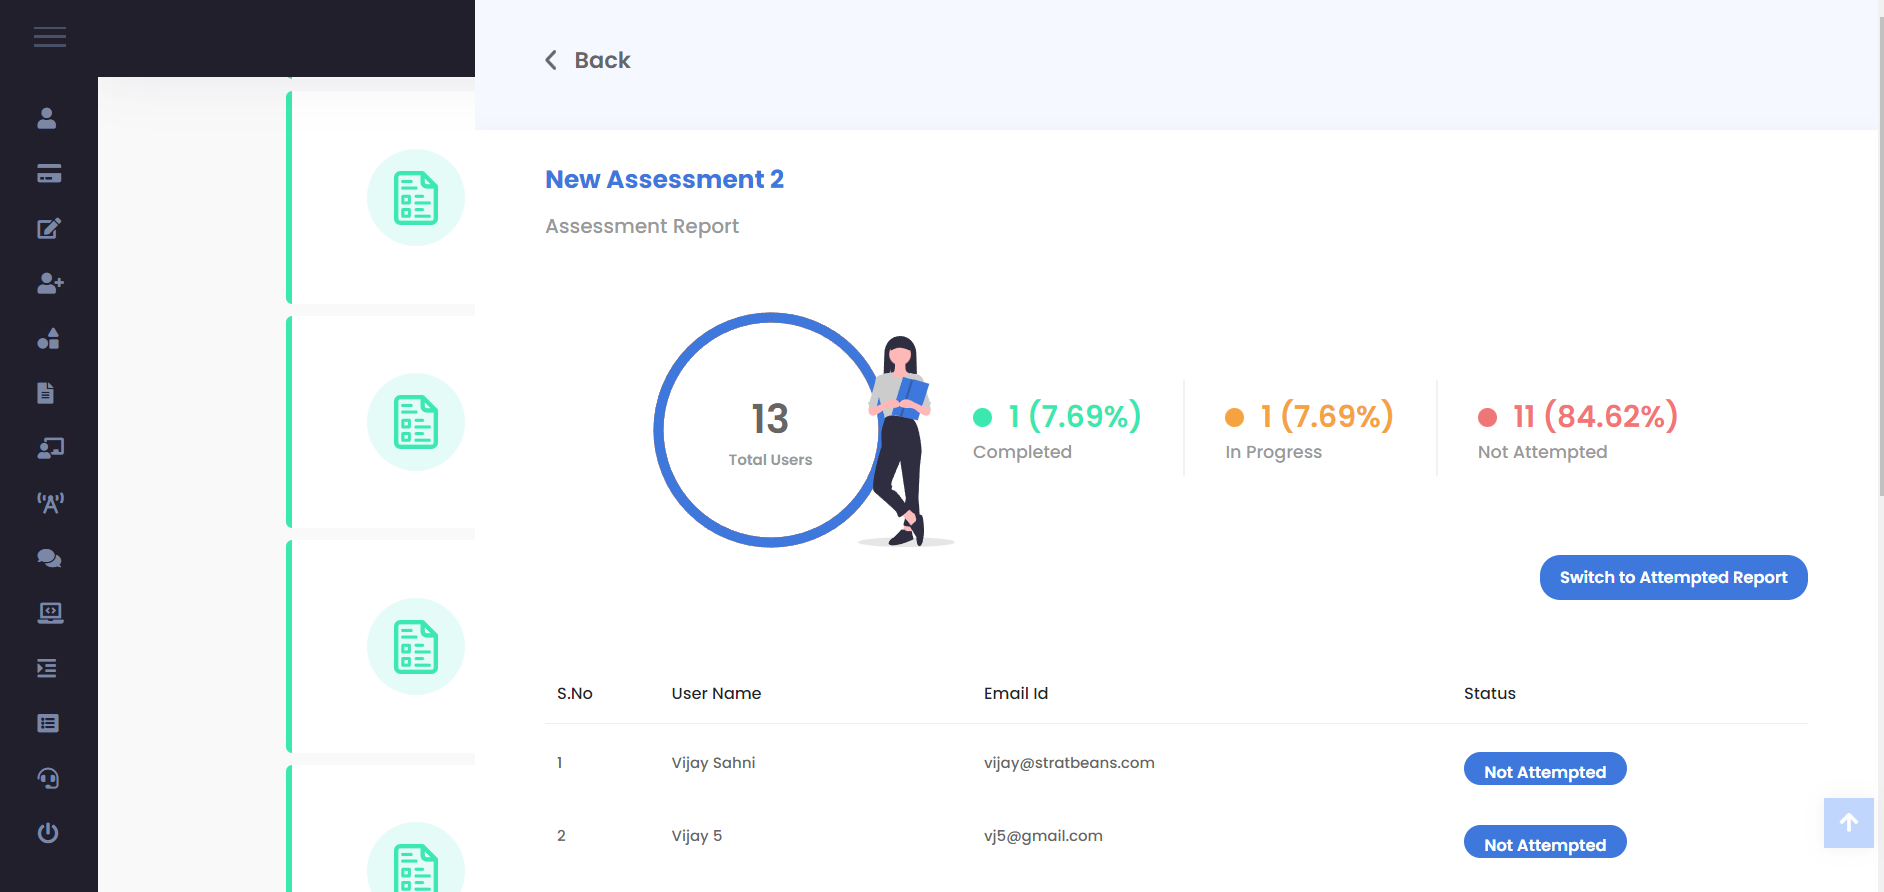
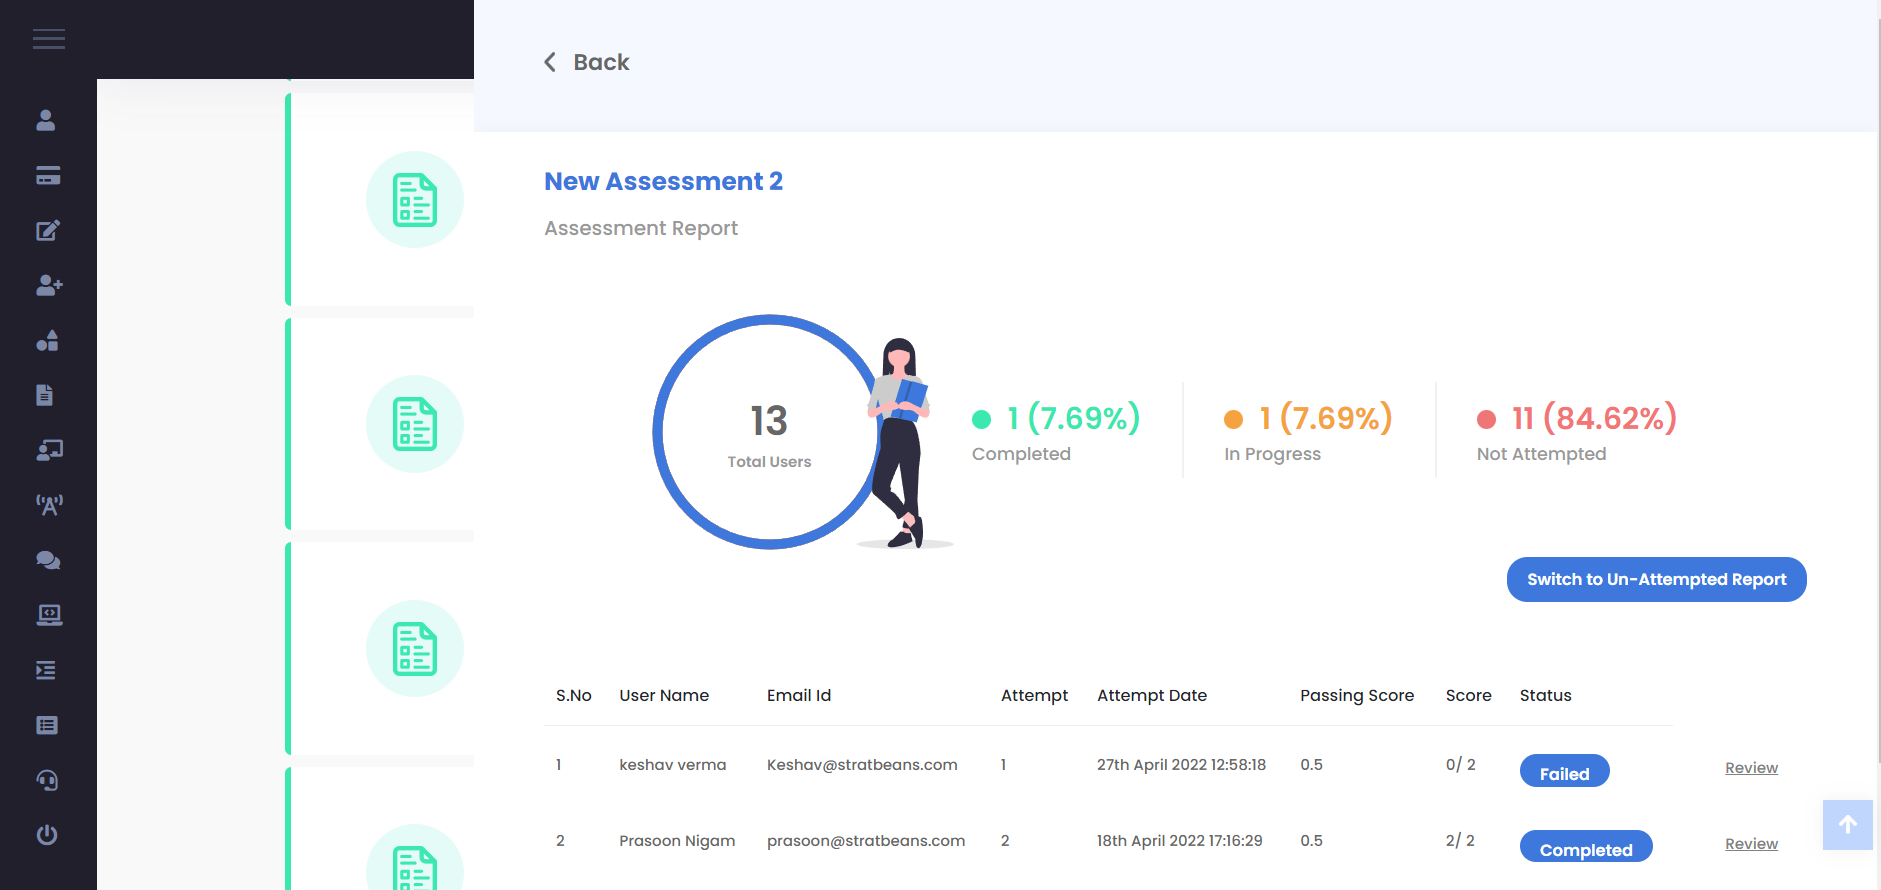
Attempted Users Report
Switch to the Attempted user report. This shows the list of users who have attempted the assessment. The number of attempts of each user is shown in a separate line and the status for each attempt. Review option for the answers attempted is also displayed.
Course Report
Similar to the assessment, the course report shows all the courses that are created and assigned to users in the system.
Each course shows the users assigned to the course. The Percentage of users who have passed, failed and Not attempted the assessment.
Right click on the 3 dots to further analyze the Attempted Users and Unattempted Users reports
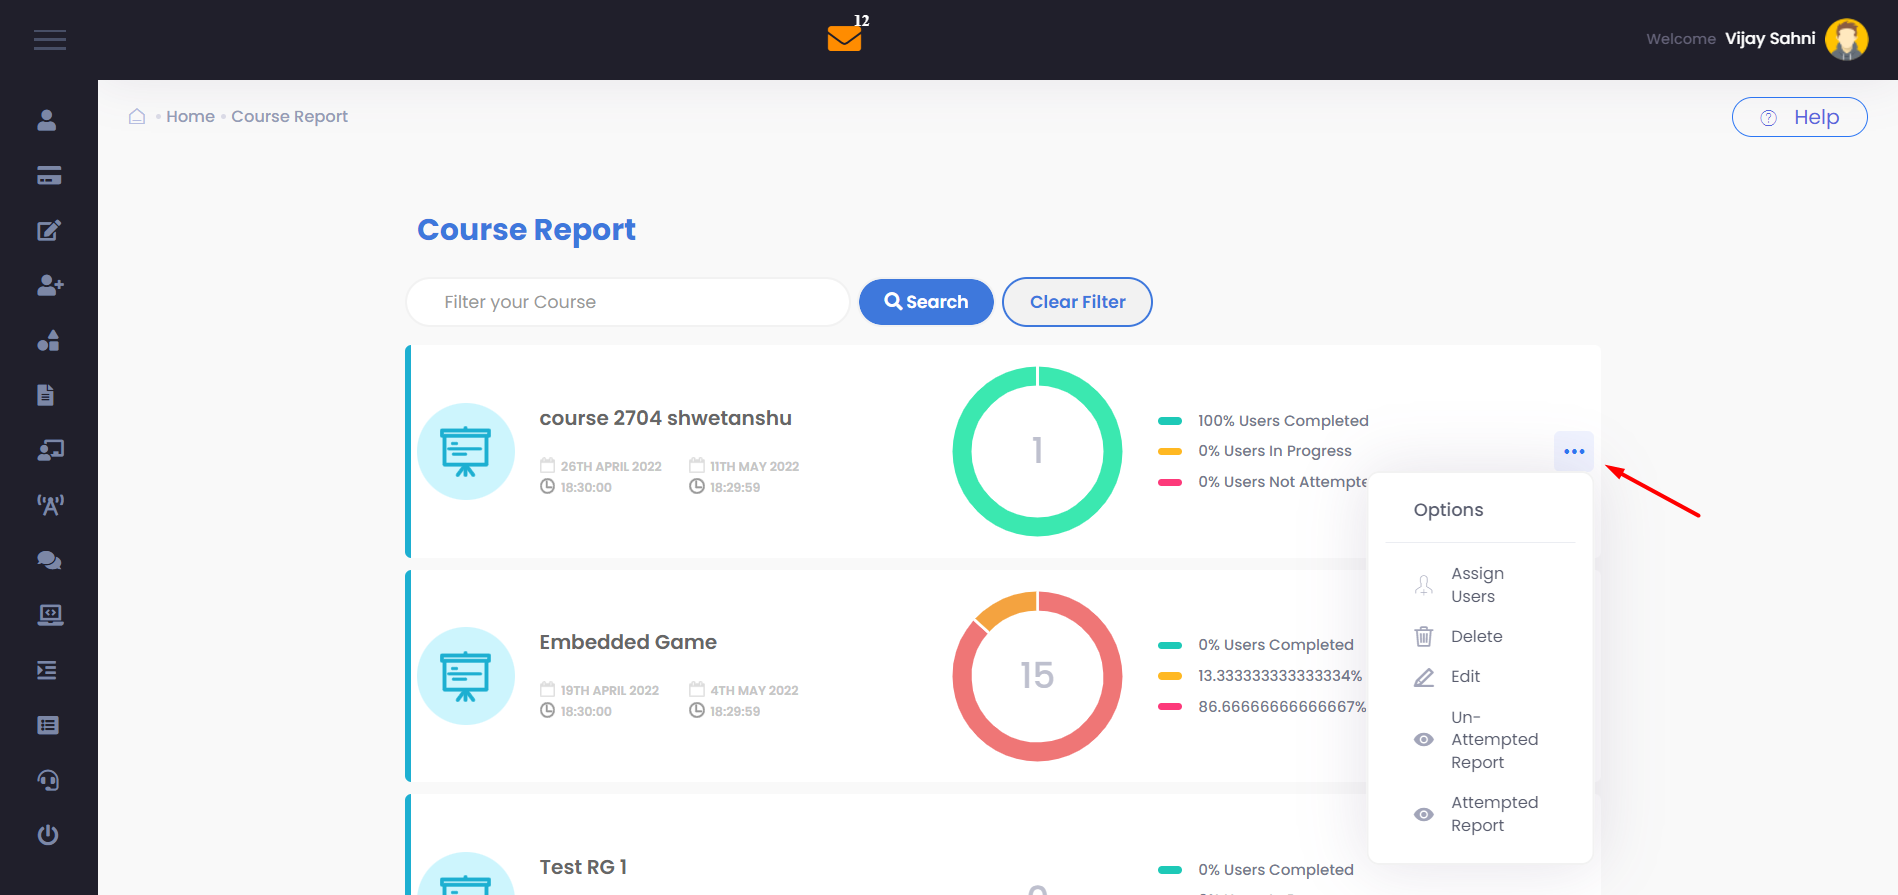
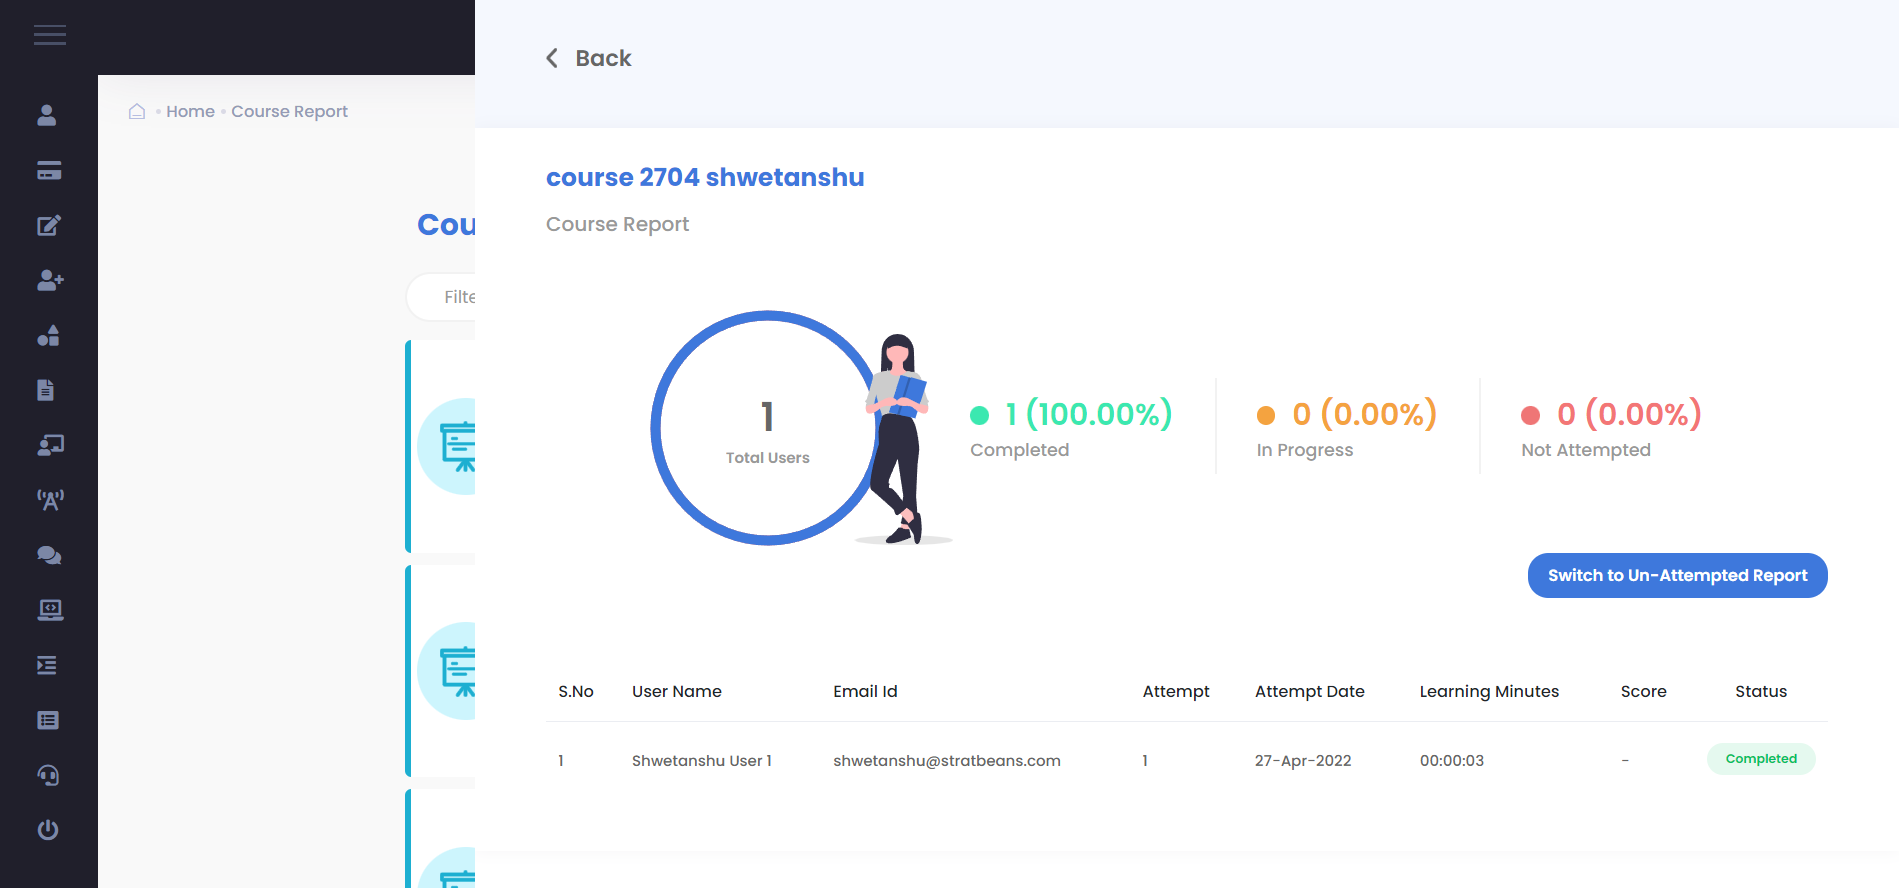
Attempted Users Report
This shows the list of users who have attempted the course. The number of attempts of each user is shown in a separate line and the status for each attempt.
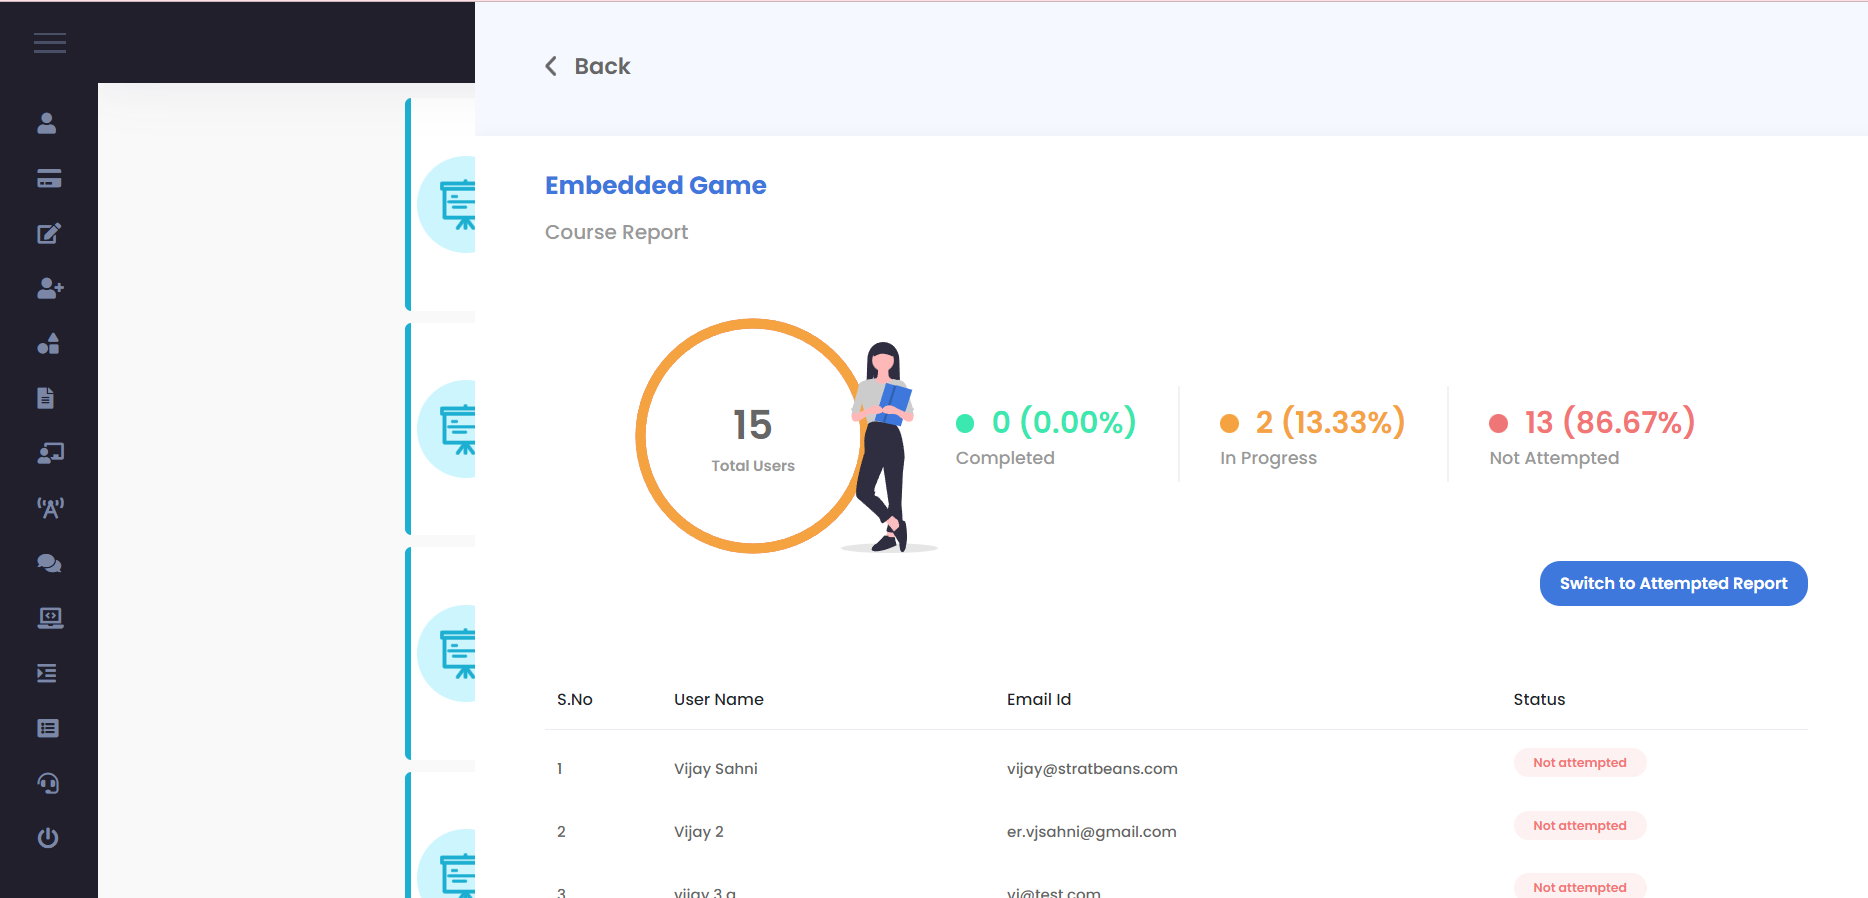
Un-attempted User Report
This shows the list of users who are assigned to the Assessment but have not yet attempted the Course even once..
Learning Path Reports
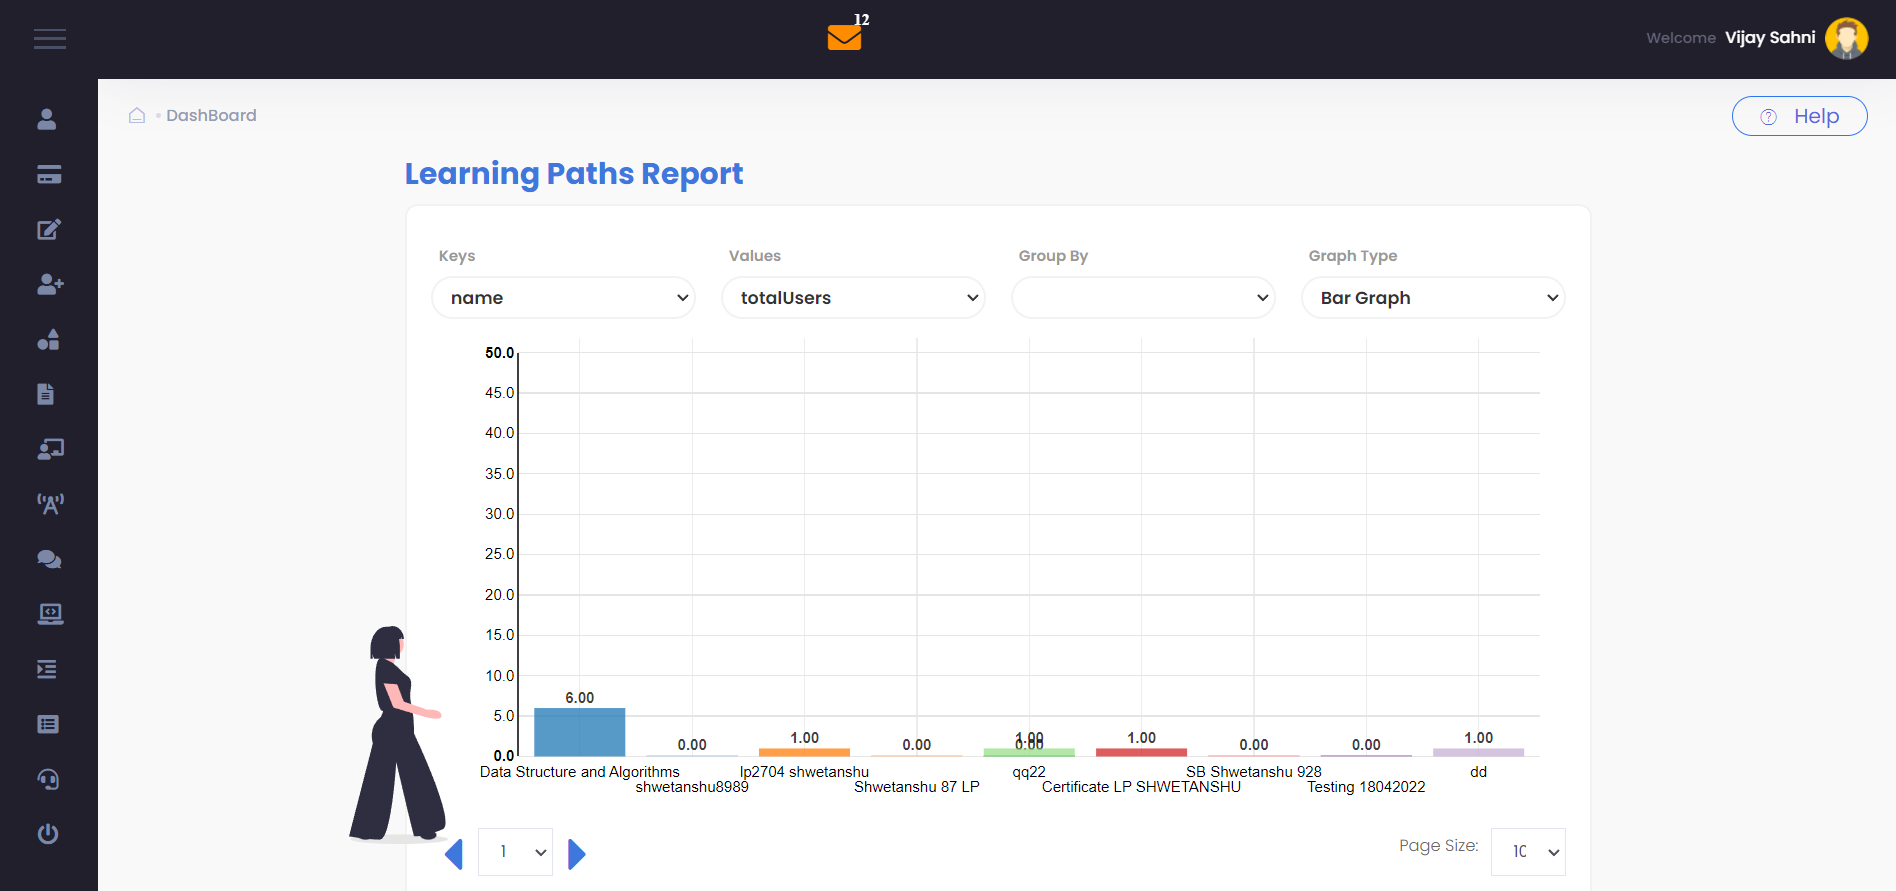
This report shows the graphical representation of Learning Paths in the system.
By default the it is selected as graph type and plotted against the Total number of users assigned. We can change the Graph type to PIE, LINE or GRAPH
Learning Path List in Reports
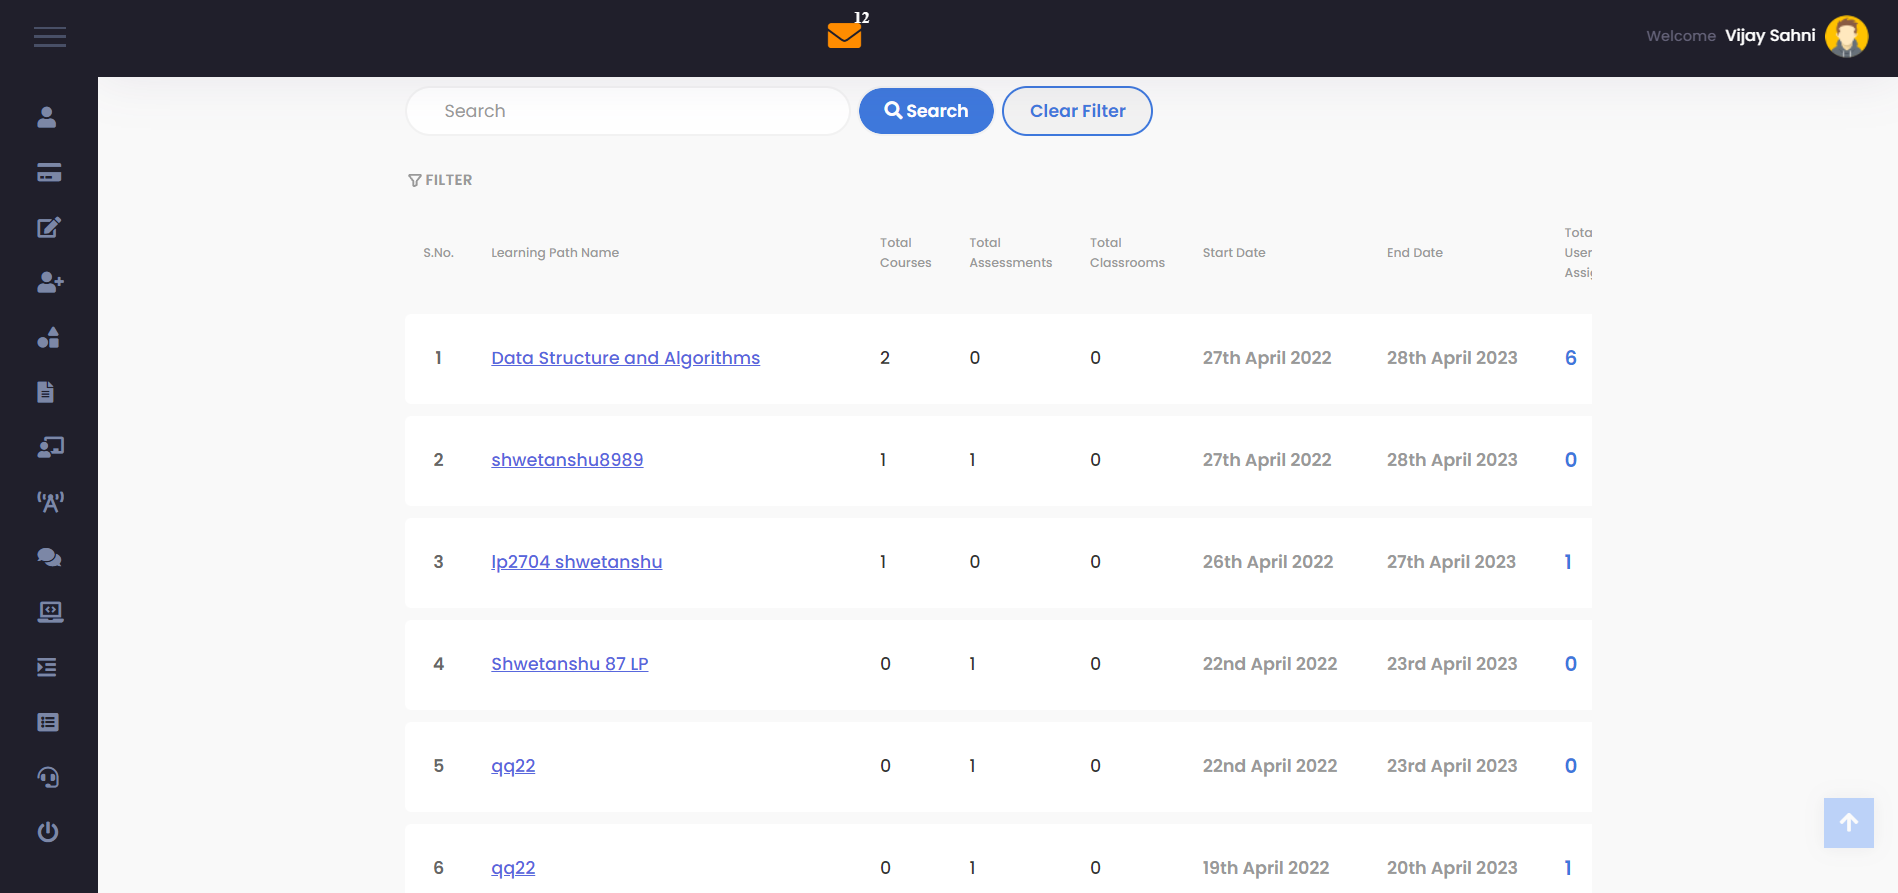
The list of Learning Paths is also displayed below in the grid, which shows the components of each Learning Path. Admin can search any learning paths using a filter or search bar
E.g.: if a Learning Path contains 2 courses and no assessment in it, the grid helps us to understand the component details better.
User – My Reports
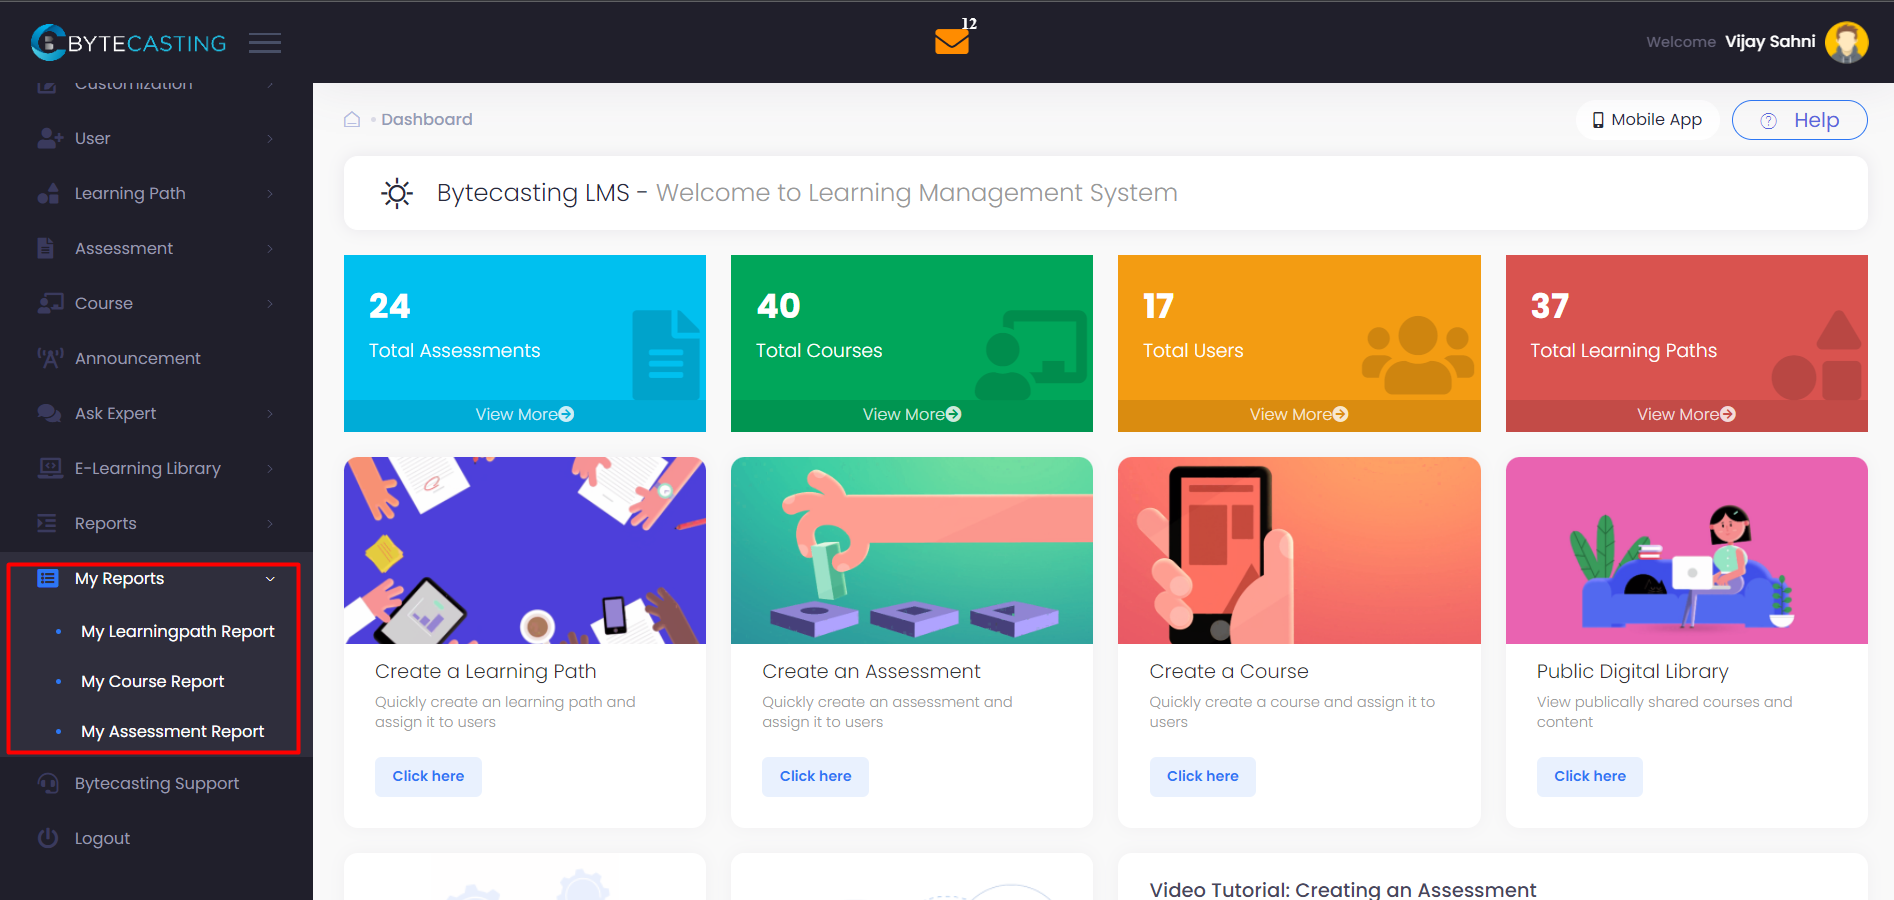
From a user perspective the reports available. These are termed as My Reports.
The user can login and view these reports from the Left Menu –My Reports
My Learning Path Report
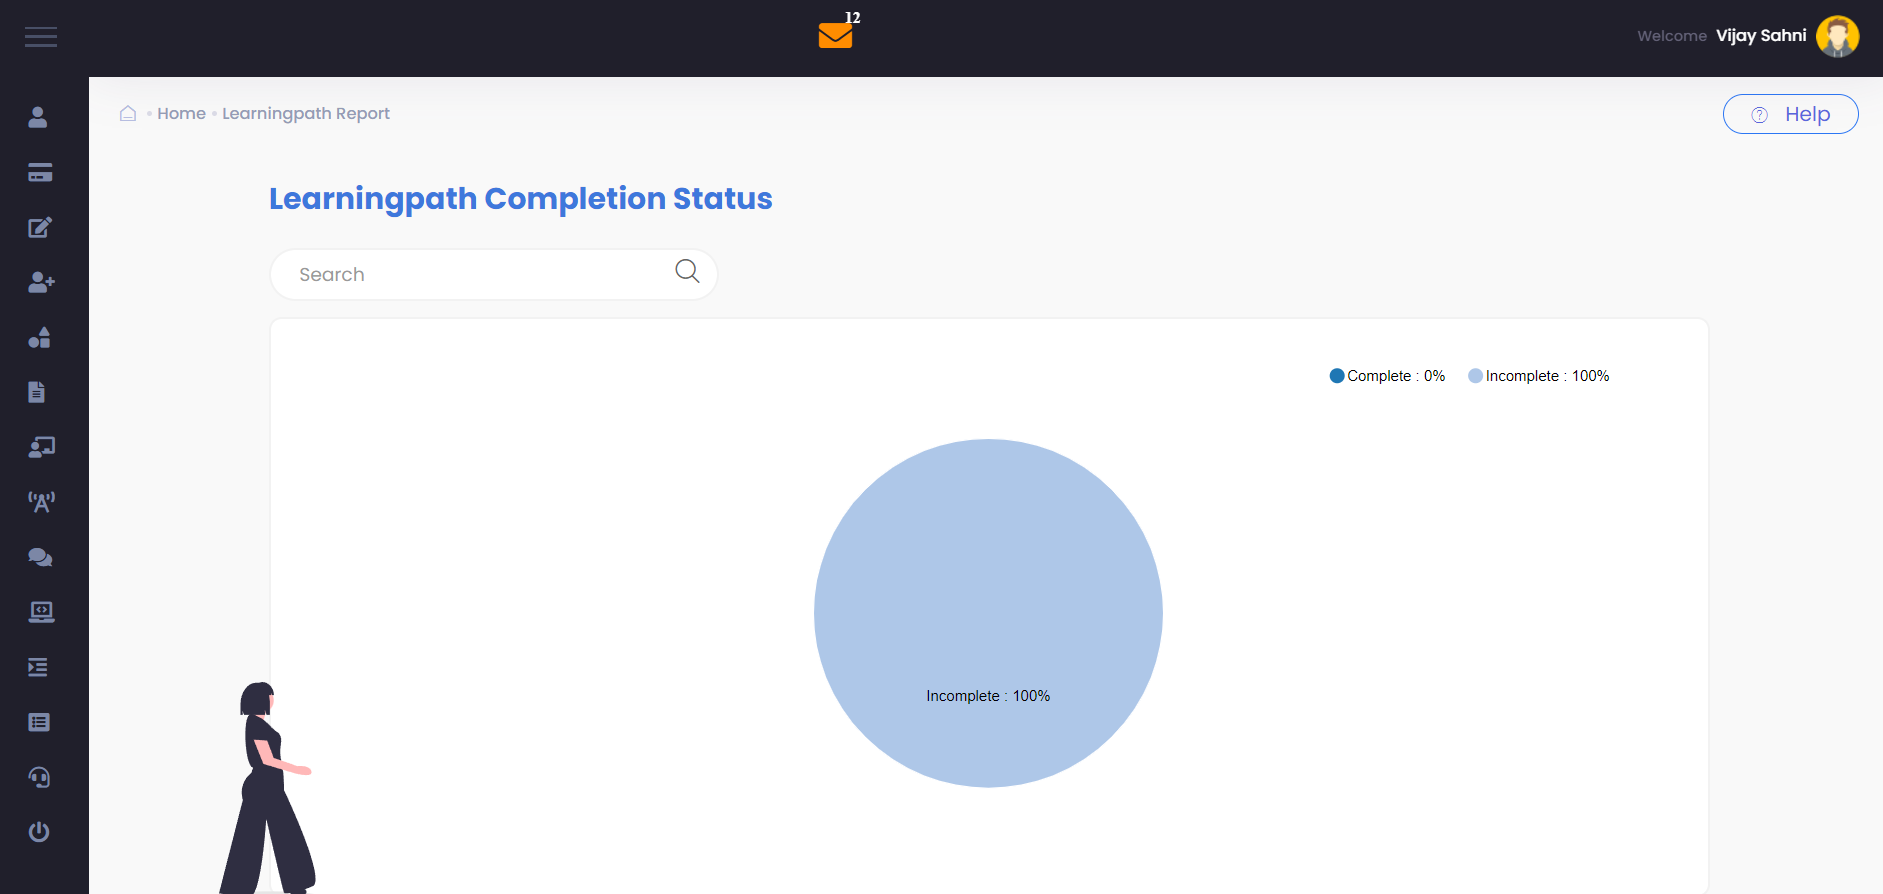
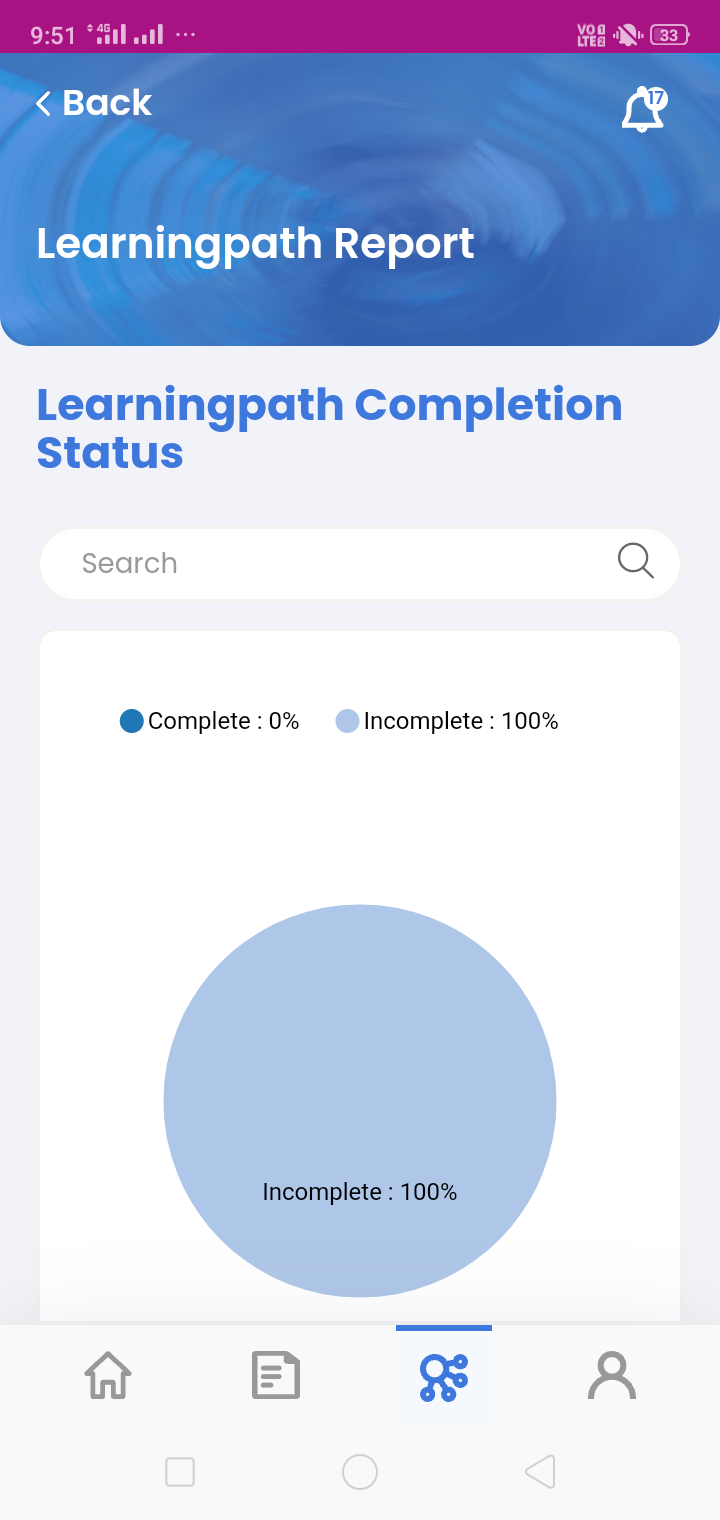
The graphical representation shows the completion rate for all Learning Paths assigned to the user.
The grid below gives a detailed description for each learning path assigned.
User can click on individual Classroom / assessment/ Course report against each Learning Path and its open the individual component report
Users can apply the filter to search assigned learning paths and can be able to download in CSV file
My Course Report
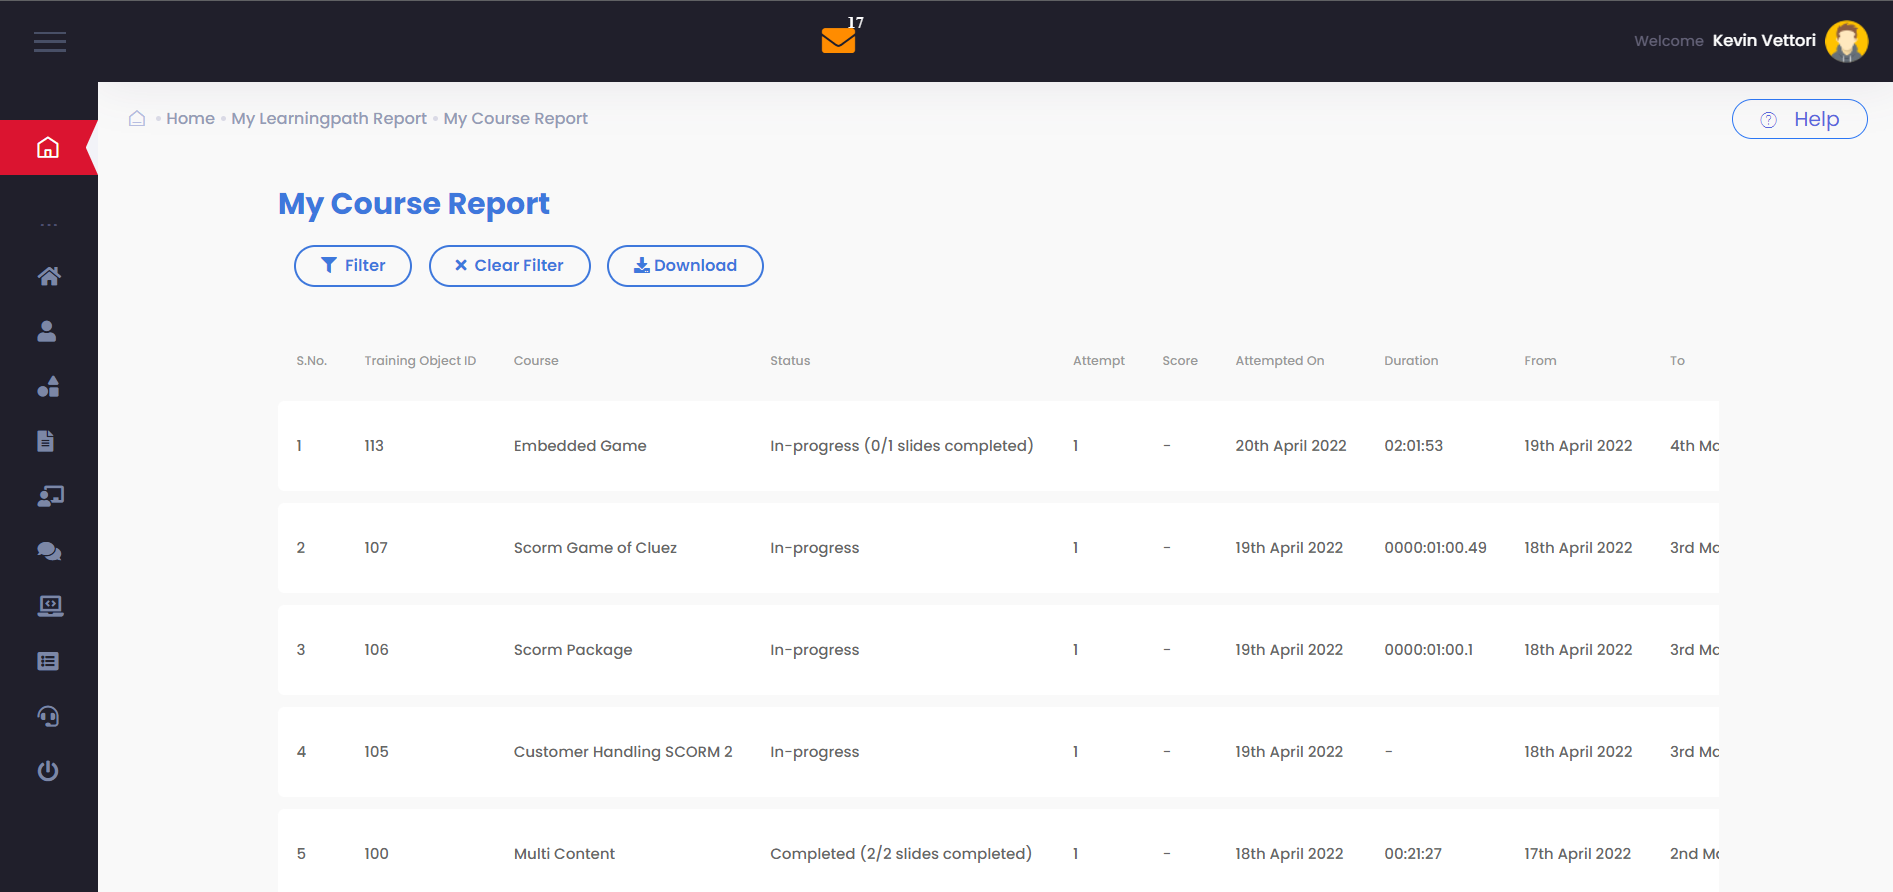
This can be accessed by the left menu My Reports My Course Report
This report shows all the assigned courses to the user. It lists the Status and number of attempts and the duration of time spent on each course.
My Assessment Report
Similar to the course report, the user ca access his/her assessments reports to analyse his learning better.
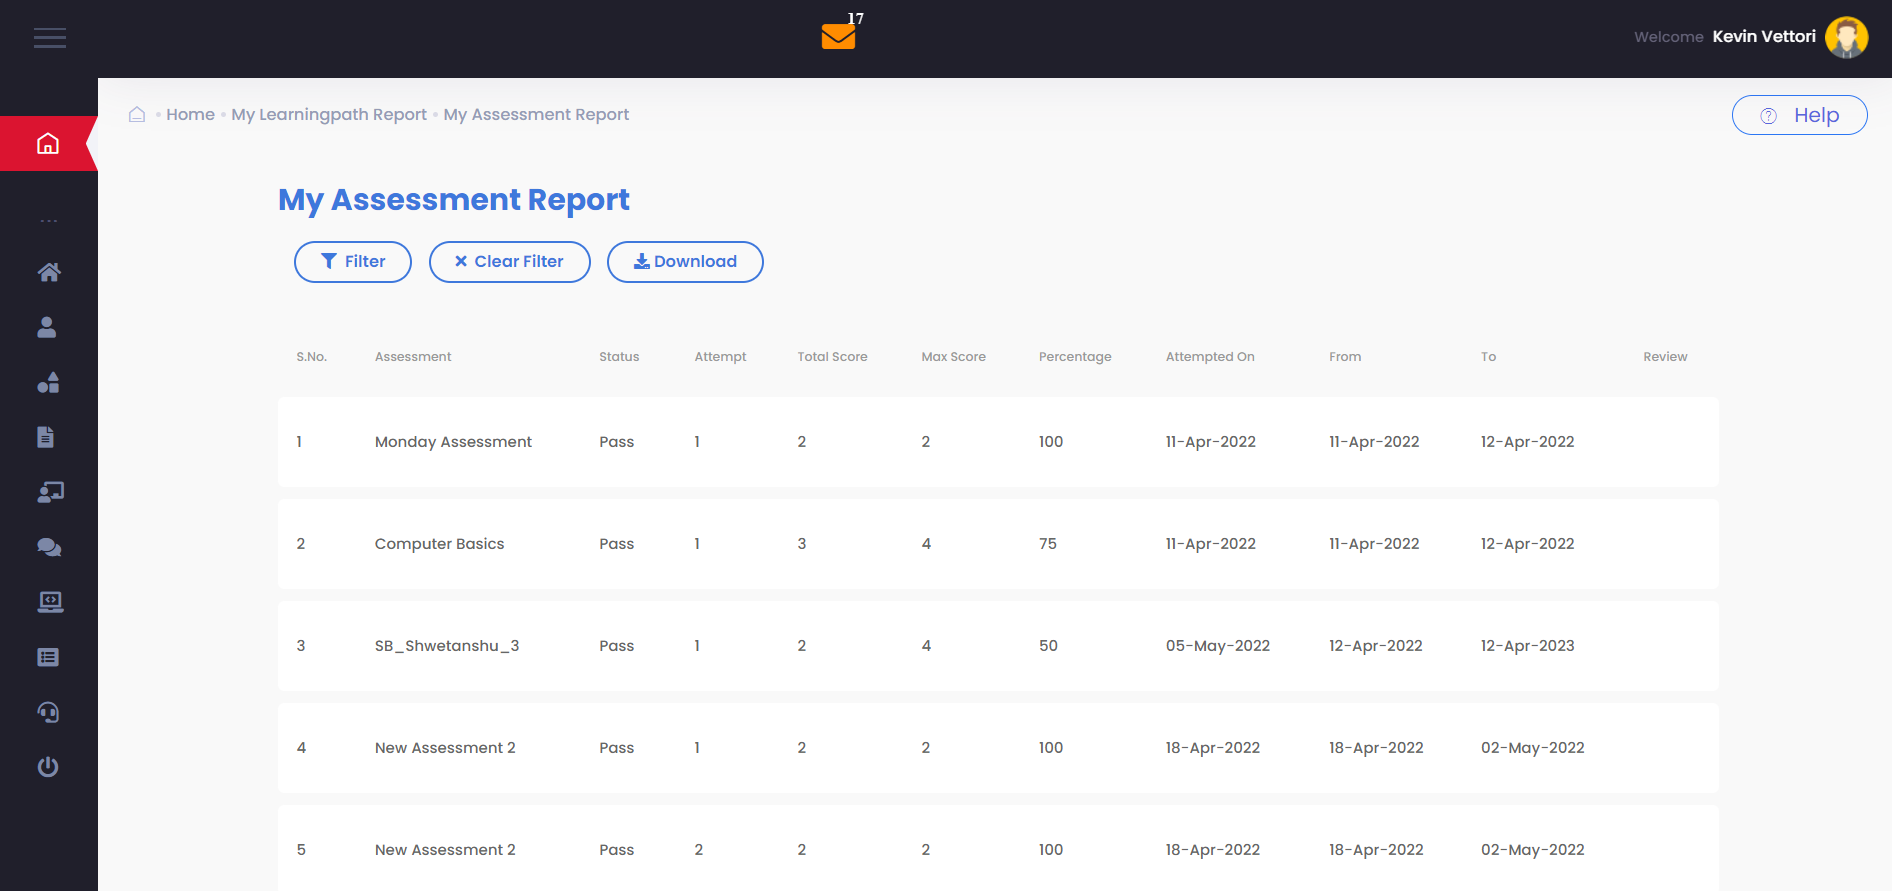
This can be accessed by the left menu My Reports My Assessment Report
This report shows all the assigned assessments to the user. It lists the Status and number of attempts, the total score achieved against the max score of each assessments.
Options to Filter and Download the data displayed in the grid, are available. This helps to download data in csv format for easier data collection.
Download Report
Download options provides us the liberty to download the data shown in a easily usable format like csv. This can be further used for analysis.
User can apply a filter for any specific date range or a particular assessment/course (depending upon the report)
Click on the download button and the csv is download. Open the csv and check the data

Reports in App
Learning Path Report
My Assessment Report in App
User can click on the Report menu in the bottom menu bar and select My Assessment Report
My Course Report in App
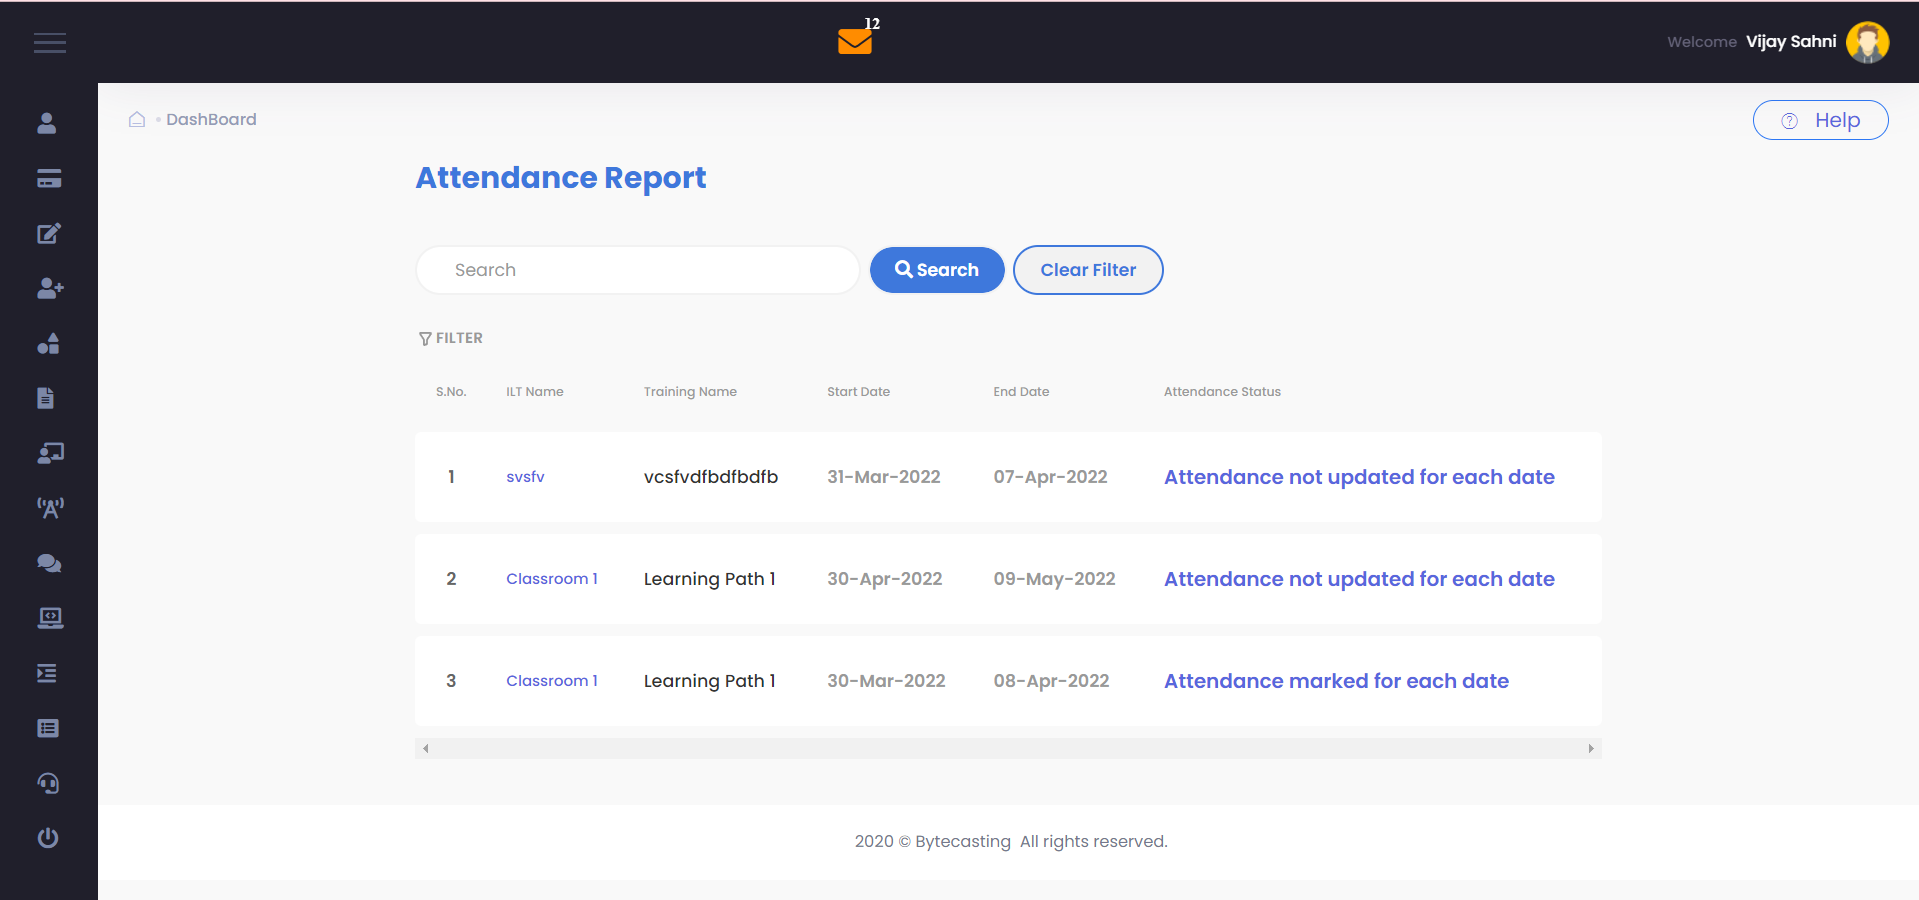
User can click on the Report menu in the bottom menu bar and select My Course Report
